In the current digital era, data is always a key solution. Its increased importance is quite obvious. The data has become both the means and the currency. If you want to get ahead in your business development, learning how to use and visualize data is essential.
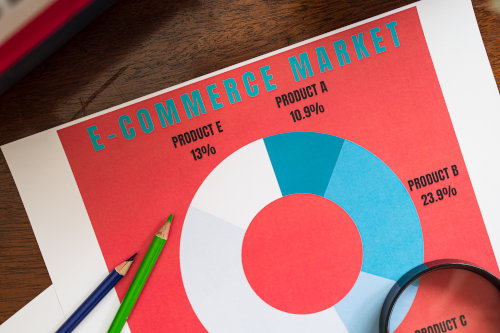
photo credit: Rodnae Productions / Pexels
Most modern businessmen have professional teams that deal with data analysis and visualization. It allows keeping the information about the company’s profits, bestsellers, customer appreciation, etc. in check. To run the company, you have a constant need to double-check every figure in your team’s reports.
The visualization helps deliver the data in the clearest form for understanding. There is often no use to list the figures and data when you speak at the meeting. The visualized data is much more appealing. It allows your audience to see the slightest deviation in numbers. When you need to analyze e-commerce data at JatApp, the proper marketing data visualization tools are required. This data is crucial for business. It helps figure out how the customer behaves, what he likes and dislikes, what he thinks about the pricing policy, etc.
The Importance of Marketing Data Visualization
When you deal with e-commerce data, you know how significant visuals are. They allow gaining the needed knowledge about the customers, their preferences, expectations, and dislikes. You can provide the data in any available format. It includes graphics, images, diagrams, charts, etc. The major significance of the displayed data is the opportunity for viewers to better understand the data. On charts and diagrams, it is easier to check the increase or decrease in numbers. Visuals help process information better.
Besides, it is well known that people are more inclined to learn visuals than a ton of numbers. Visuals are a great educational instrument since they help students learn the material faster. It is no use to name a huge list of numbers without any following visuals. The numbers are easy to forget and not everyone can create a picture in their mind. Thus, the need to visualize company data is quite logical.
It is both great to have visuals to be presented at meetings and be offered online as a part of the statistics or online marketing section.
The Latest Data Visualization Trends
If you know how to run a successful firm, you know that visualization brings a clearer picture. It helps present the data in the most understandable and memorable format. It is easier to grasp the information if it is envisioned.
Certain tips can help you to choose the best way to visualize data. They also help to appreciate the importance of visualized data fully. Further, it encourages the following creation of an effective and timely marketing strategy.

Clear Data Presentation with Advanced Tools
Once you have data gathered and analyzed, you can share it with your employees and shareholders. This data defines the success of your product or service. In particular, the sales’ effectiveness. It also shows the area that must be improved.
Most e-commerce data are in fact huge amounts of vital information on products or services. If you try to grasp it in its original form, you risk blowing up your brain. Endless sheets of numbers can bring you only a headache. Thus, it is logical why modern developers come up with the most effective analytical and visualization tools. They help display the data in a way it becomes clear and understandable for viewers. Do not be afraid to use the latest devices and tools to get the wanted visuals.
Every year there are more advanced tools that help with fast and convenient data visualization. It includes Google Charts, Plotly, Infogram, etc. These up-to-date tools are one of the best in the current market.
Better Options to Define the Bestsellers with Visuals
Once you have a diagram or chart with information on your sales, you can see the winning product or service. If you are selling hats, and your purple hat was bought by 56% of your customers, you have a bestseller. At the same time, if the green hat was bought by 3% of your buyers, you can work more on changing your assortment. The product that does not attract customers, should be taken off your website. It is better to focus on the things that really sell well. Besides, once defining the best-selling product, you can gain additional online visibility.
Share the information about the best-selling item on your social media pages to gain even more customers. This is how digital companies reach more customers every day.
Upgraded Targeted Advertisements with Visuals
You can easily use visuals in your marketing campaign. Telling customers that your business is very popular and successful is one thing. Offering them visuals to support your sayings is a fully another story. You can use graphics, charts, and images to improve your online appearance and reputation. Besides, you can share your best sellers with the customers in a few simple clicks.
It is a great idea to post a graph with a high rate of your customers’ satisfaction on your website to show potential clients how great your services are. With visuals, you can upgrade your advertising campaign and add more sincerity to your online image. You can use numerous modern tools to get the wanted images and graphs.

Conclusions
Visuals are a great way to display e-commerce data. They are very essential since they help to explain the e-commerce information. Besides, they are quite memorable and well-projected. Thus, it is easier for people to memorize visuals than remember huge amounts of original data. If you need to find the best methods to visualize your e-commerce information, you are free to use any modern tools and programs. Besides, visualized data can be used in online marketing campaigns very efficiently.
Visuals help gain additional visibility and sincerity. It always influences the business positively.