In our digital age, the ability to communicate complex data to diverse audiences is an increasingly valuable skill. A crucial element of that skill is understanding when, how, and why to use various types of visual data representations, such as an area chart.
In this article, we will dive deeply into the world of area charts. We will explore their strengths and weaknesses, learn when to use them, and discover valuable tips and tricks for creating effective and compelling visual data communications using area charts. Keep reading to learn more!
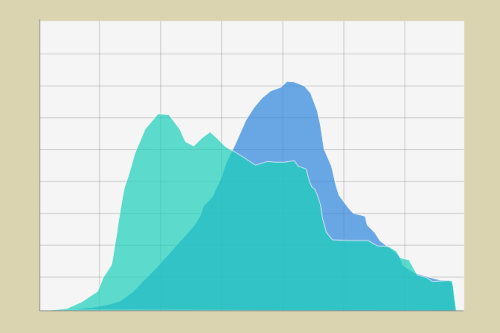
Understanding Area Charts
Before diving into the intricacies of the area chart, we first need to understand what it is.…
Continue reading